Fig. 4
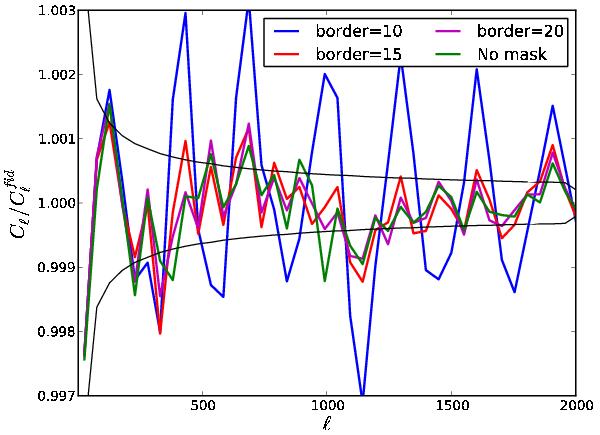
Ratio of the mean of the N = 100 power spectra of the inpainted maps to the fiducial power spectrum for three values of the width of the region used for constraining the Gaussian realization; 10 (blue), 15 (red), and 20 (magenta) pixels. The green line represents the case where no mask is applied. Black lines are the cosmic variance expected given the number of simulations and binning.
Current usage metrics show cumulative count of Article Views (full-text article views including HTML views, PDF and ePub downloads, according to the available data) and Abstracts Views on Vision4Press platform.
Data correspond to usage on the plateform after 2015. The current usage metrics is available 48-96 hours after online publication and is updated daily on week days.
Initial download of the metrics may take a while.