Fig. 1
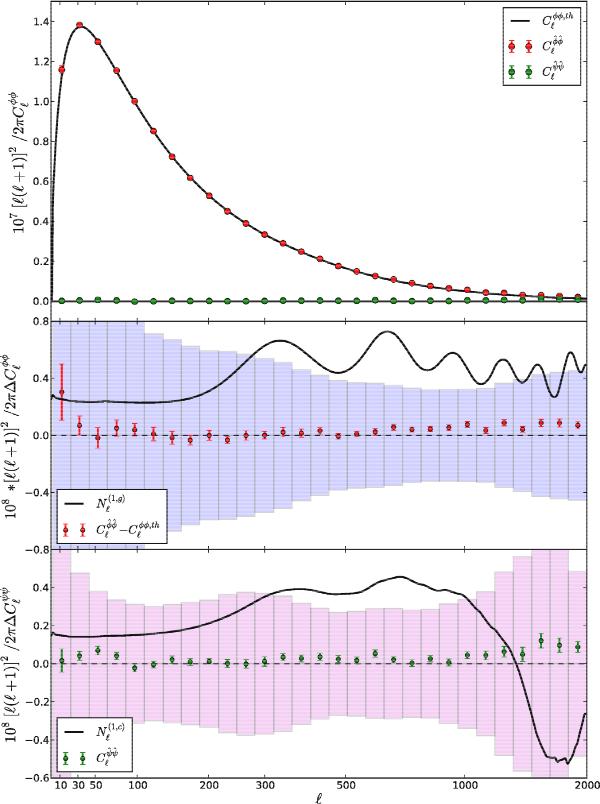
Reconstructed power spectrum of the lensing potential averaged over 300 full-sky lensed simulations. Red dots represent the gradient mode of the deflection (i.e. the lensing potential). Green dots represent the reconstructed curl modes. Middle and bottom panels represent the residuals over 300 lensed simulations of the gradient (middle) and curl (bottom), with the corresponding first-order bias term (black lines). Filled rectangles represent the theoretical dispersion expected for one single reconstruction (Eqs. (27) and (30)). Error bars on the data points are the realization variance on 300 simulations.
Current usage metrics show cumulative count of Article Views (full-text article views including HTML views, PDF and ePub downloads, according to the available data) and Abstracts Views on Vision4Press platform.
Data correspond to usage on the plateform after 2015. The current usage metrics is available 48-96 hours after online publication and is updated daily on week days.
Initial download of the metrics may take a while.