Fig. 4
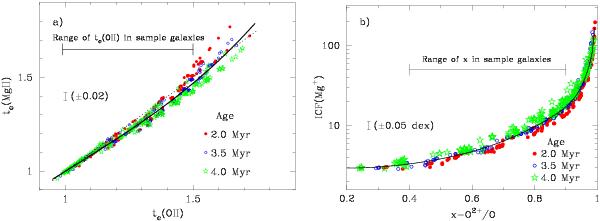
a) Relation between the electron temperatures te(Mg ii) and te(O ii). te are in units of 10-4 Te. Red filled circles, blue open circles, and green stars are data from CLOUDY models with starburst ages of 2.0 Myr, 3.5 Myr, and 4.0 Myr, respectively. The solid line is the fit to data with all ages, defined by Eq. (2). The dotted line is the line of equal temperatures. The range of the electron temperature te(O ii) in the sample galaxies is shown by a horizontal line. The error bar is the dispersion of te(Mg ii) in the range of te(O ii) shown by the vertical line. b) Relation between the ionisation correction factor ICF(Mg+) and the excitation parameter x = O2+/O. Red filled circles, blue open circles, and green stars are data from CLOUDY models with starburst ages of 2.0 Myr, 3.5 Myr, and 4.0 Myr, respectively. The solid line is the fit to data with all ages as defined by Eq. (5) with the coefficients from Table 3. The range of the excitation parameter x in the sample galaxies is shown by a horizontal line. The error bar is the dispersion of ICF(Mg+) (in dex) in the range of x shown by the vertical line.
Current usage metrics show cumulative count of Article Views (full-text article views including HTML views, PDF and ePub downloads, according to the available data) and Abstracts Views on Vision4Press platform.
Data correspond to usage on the plateform after 2015. The current usage metrics is available 48-96 hours after online publication and is updated daily on week days.
Initial download of the metrics may take a while.