Fig. 1
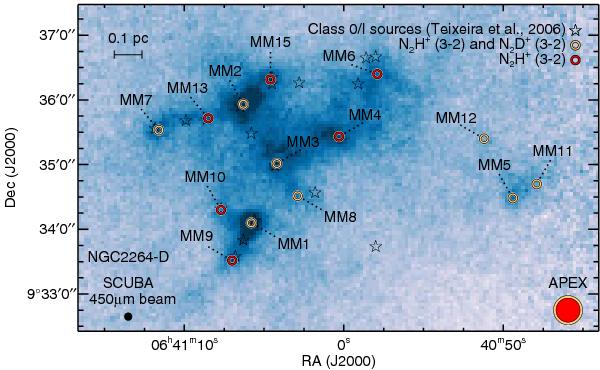
SCUBA 450 μm dust-continuum map for the Spokes cluster (Wolf-Chase et al. 2003). The observed dense cores identified in Peretto et al. (2006) are shown by the circles at their centers (color-coded according to which molecular line tracers were used in their observation). For comparison, the APEX beams corresponding to our observations are also shown in the lower right corner (following the same color-code convention).
Current usage metrics show cumulative count of Article Views (full-text article views including HTML views, PDF and ePub downloads, according to the available data) and Abstracts Views on Vision4Press platform.
Data correspond to usage on the plateform after 2015. The current usage metrics is available 48-96 hours after online publication and is updated daily on week days.
Initial download of the metrics may take a while.