Fig. 8
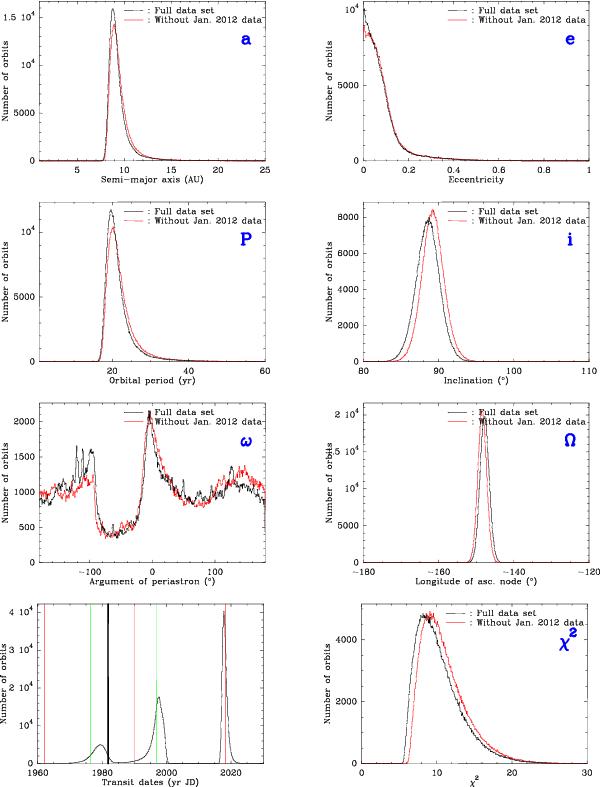
Distribution of orbital parameters from the MCMC fit of the set of astrometric data from Chauvin et al. (2012) (black), including the new astrometric data point gathered from the new H-band data (red; see Sect. 3.2). Top row: semi-major axis a (left) and e (right). Third row bottom: period P (left) and inclinaison i (right). Second row from bottom: argument of periastrom ω (left) and longitude of ascending node Ω (right). Bottom row: transit date (left) and distribution of χ2. Red bars correspond to parameters found from the best LSLM χ2 model. Green bars correspond to highly probable orbital parameters derived from the MCMC approach. The 1981 photometric events is reported as a thick black bar in the bottom-left diagram.
Current usage metrics show cumulative count of Article Views (full-text article views including HTML views, PDF and ePub downloads, according to the available data) and Abstracts Views on Vision4Press platform.
Data correspond to usage on the plateform after 2015. The current usage metrics is available 48-96 hours after online publication and is updated daily on week days.
Initial download of the metrics may take a while.