Free Access
Fig. 8
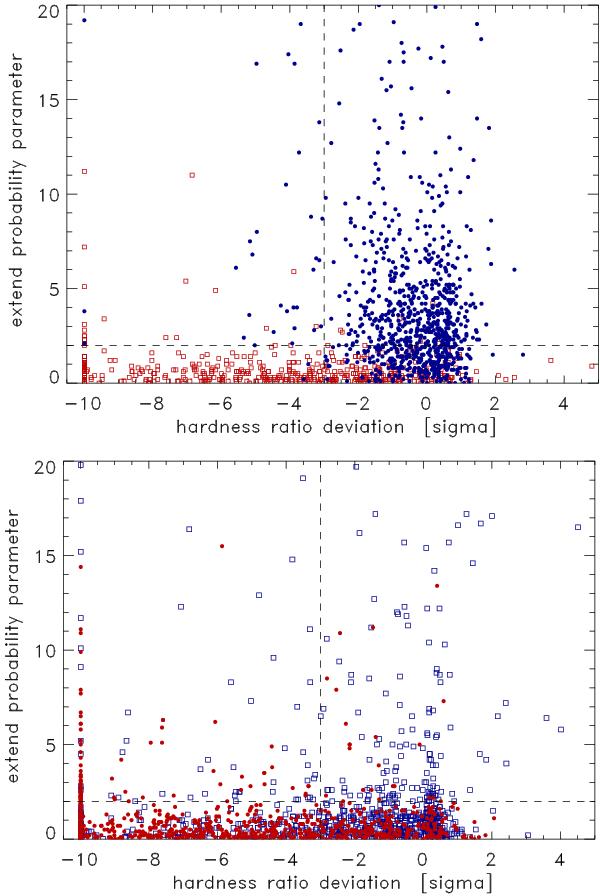
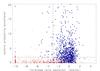
Comparison of the distribution of the hardness ratio and source extent parameters of X-ray sources identified as clusters (blue dots), and tentatively classified AGN (red squares) in the upper panel and stars (red dots) as well as unidentified sources (blue squares) in the lower panel.
This figure is made of several images, please see below:
Current usage metrics show cumulative count of Article Views (full-text article views including HTML views, PDF and ePub downloads, according to the available data) and Abstracts Views on Vision4Press platform.
Data correspond to usage on the plateform after 2015. The current usage metrics is available 48-96 hours after online publication and is updated daily on week days.
Initial download of the metrics may take a while.