Free Access
Fig. 5
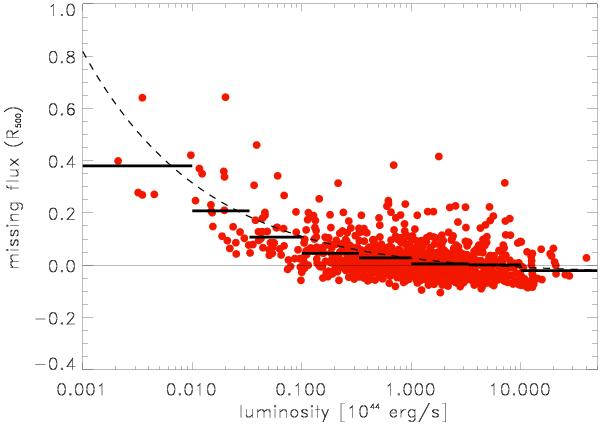
Estimated missing flux as a function of X-ray luminosity for the clusters in the REFLEX II sample. The horizontal bars show the mean values in 8 X-ray luminosity bins. The dashed line shows the best fitted power law function with linear offset as given in Eq. (6).
Current usage metrics show cumulative count of Article Views (full-text article views including HTML views, PDF and ePub downloads, according to the available data) and Abstracts Views on Vision4Press platform.
Data correspond to usage on the plateform after 2015. The current usage metrics is available 48-96 hours after online publication and is updated daily on week days.
Initial download of the metrics may take a while.