Fig. 15
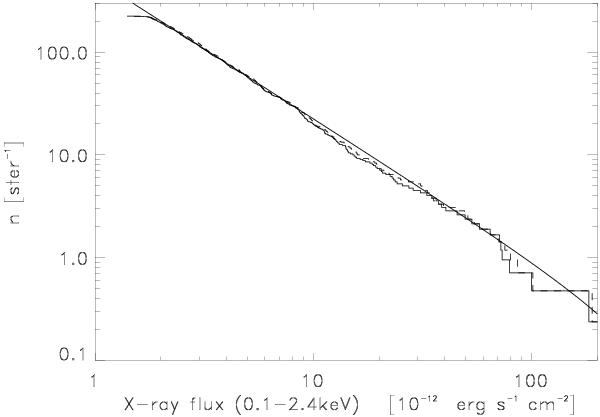
Log N − log S distribution of the REFLEX II clusters. The solid step function shows the log N − log S-function for the observed flux, FX, and the dashed function the flux corrected to an aperture of r500. The solid line shows a power law function convolved with a flux dependent flux error and fitted to the data by means of a maximum likelihood method. The underlying power law function has a slope of 1.36( ± 0.07).
Current usage metrics show cumulative count of Article Views (full-text article views including HTML views, PDF and ePub downloads, according to the available data) and Abstracts Views on Vision4Press platform.
Data correspond to usage on the plateform after 2015. The current usage metrics is available 48-96 hours after online publication and is updated daily on week days.
Initial download of the metrics may take a while.