Fig. 13
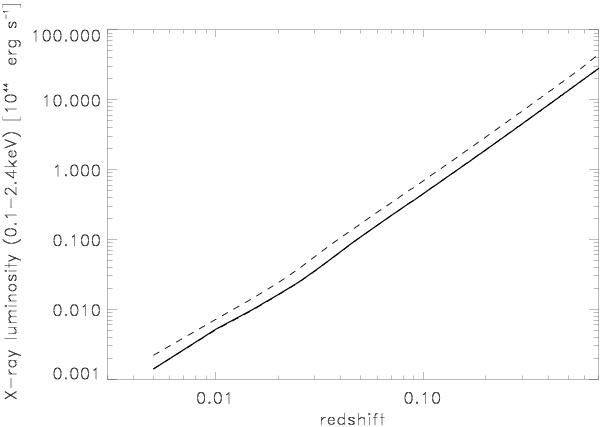
X-ray luminosity limit for the cluster X-ray source detection as a function of redshift. The solid line shows the median for the survey area while the dashed line shows the values for the 10% area with the lowest sensitivity. If we would plot other percentiles from 30 to 90%, they would hardly be distinguishable from the median line.
Current usage metrics show cumulative count of Article Views (full-text article views including HTML views, PDF and ePub downloads, according to the available data) and Abstracts Views on Vision4Press platform.
Data correspond to usage on the plateform after 2015. The current usage metrics is available 48-96 hours after online publication and is updated daily on week days.
Initial download of the metrics may take a while.