Free Access
Fig. 8
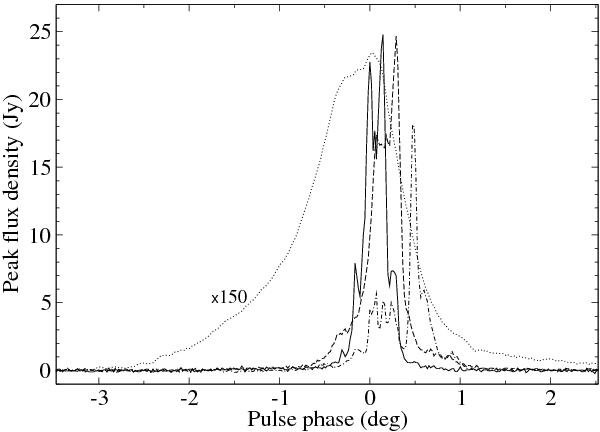
Three strongest pulses (solid, dashed and dot-dashed lines) from observations of PSR B1133+16 in April 2004 relative to the first component of the integrated profile (dotted line), multiplied by a factor of 150. The complex pulse structure and tendency to occurr at the trailing edge of the first component is shown.
Current usage metrics show cumulative count of Article Views (full-text article views including HTML views, PDF and ePub downloads, according to the available data) and Abstracts Views on Vision4Press platform.
Data correspond to usage on the plateform after 2015. The current usage metrics is available 48-96 hours after online publication and is updated daily on week days.
Initial download of the metrics may take a while.