Fig. 5
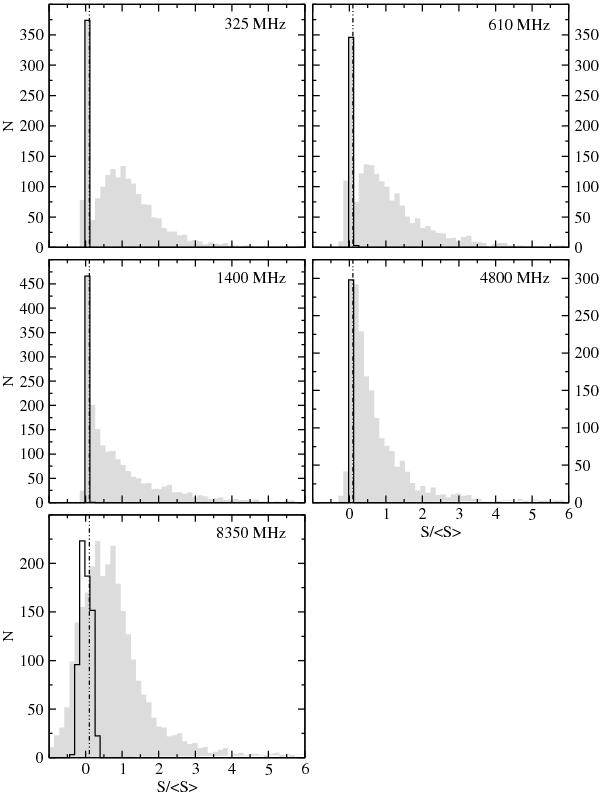
Pulse-energy distributions for the pulsar B1133+16. Panels presenting distribution for frequencies from 325 MHz to 4800 MHz are produced using data from Bhat et al. (2007). The panel for 8.35 GHz presents the pulse-energy distribution prepared from our data. The vertical dotted line represents an integrated-intensity threshold of 0.10 ⟨ S ⟩ to distinguish the nulls. Filled grey regions show the on-pulse energy, while the black contour denotes the off-pulse energy. The offpulse noise is included for every pulse, but due to the large number of offpulse values near zero, their distributions were scaled according to the highest onpulse bin. 139 pulses with S langleS ⟩ above 6 were removed from the 8.35 GHz panel to retain the same scale of the plots.
Current usage metrics show cumulative count of Article Views (full-text article views including HTML views, PDF and ePub downloads, according to the available data) and Abstracts Views on Vision4Press platform.
Data correspond to usage on the plateform after 2015. The current usage metrics is available 48-96 hours after online publication and is updated daily on week days.
Initial download of the metrics may take a while.