Fig. 8
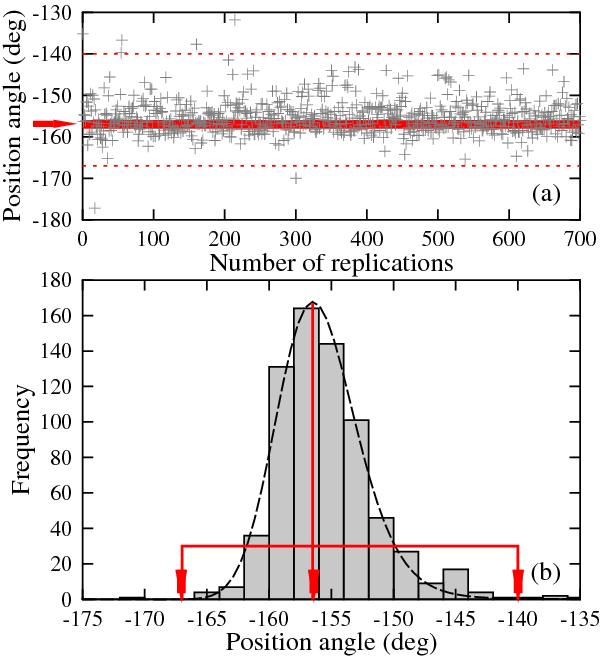
a) Simulated position angle PA against the number of “bootstrap” replications when β = 0.19. The colored line indicates the position angle PA of maximum probability. b) Frequency distribution of the simulated position angles PA (histogram and smoothed distribution). In the figure are also indicated the position angle PA of maximum probability and the 99% confidence interval.
Current usage metrics show cumulative count of Article Views (full-text article views including HTML views, PDF and ePub downloads, according to the available data) and Abstracts Views on Vision4Press platform.
Data correspond to usage on the plateform after 2015. The current usage metrics is available 48-96 hours after online publication and is updated daily on week days.
Initial download of the metrics may take a while.