Fig. 4
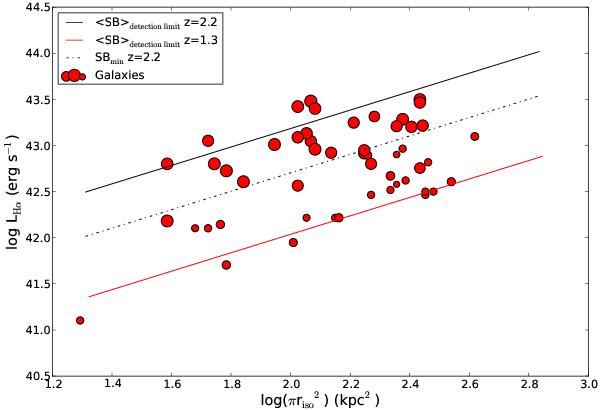
Plot of Hα luminosities versus isophotal area for the galaxies in our sample (red circles). The size of each circle is proportional to the redshift of the galaxy, with larger circles denoting higher redshifts (range in z is 1.3–2.7). The two solid lines show the relationship between luminosity and area for the average surface brightness detection level of galaxies, 1.1 × 10⁻¹⁷ erg s-1 cm-2 arcsec-2 (black for galaxies at z = 2.2 and red for z = 1.3, respectively). The dot-dashed line shows the relationship for the minimum surface brightness detection limit of 3.6 × 10⁻¹⁸ erg s-1 cm-2 arcsec-2 for all galaxies with z ≈ 2.2. See Table 1 for the Hα luminosities, isophotal radii and surface brightness detection limits.
Current usage metrics show cumulative count of Article Views (full-text article views including HTML views, PDF and ePub downloads, according to the available data) and Abstracts Views on Vision4Press platform.
Data correspond to usage on the plateform after 2015. The current usage metrics is available 48-96 hours after online publication and is updated daily on week days.
Initial download of the metrics may take a while.