Fig. 3
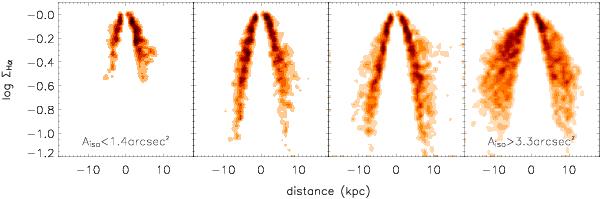
Two-dimensional histograms of the relative frequency of occurrence of normalized Hα surface brightness values versus the projected distance for galaxies in 4 equal-size bins in galaxy number selected on their isophotal area (Aiso). The relative frequency of occurrence is scaled in the same way as in Fig. 2. From left to right, each panel represents an increasing angular size (i.e., Aiso < 1.4 arcsec2, 1.4 arcsec2 ≥ Aiso < 2.5 arcsec2, 2.5 arcsec2 ≥ Aiso < 3.3 arcsec2 and Aiso ≥ 3.3 arcsec2). The values of riso, which is derived from Aiso, for individual galaxies are given in Table 1. The galaxies with the smaller dynamic range (higher surface brightness detection limits) in the data are also smaller in isophotal size.
Current usage metrics show cumulative count of Article Views (full-text article views including HTML views, PDF and ePub downloads, according to the available data) and Abstracts Views on Vision4Press platform.
Data correspond to usage on the plateform after 2015. The current usage metrics is available 48-96 hours after online publication and is updated daily on week days.
Initial download of the metrics may take a while.