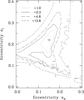
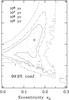
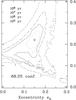
Fig. 3
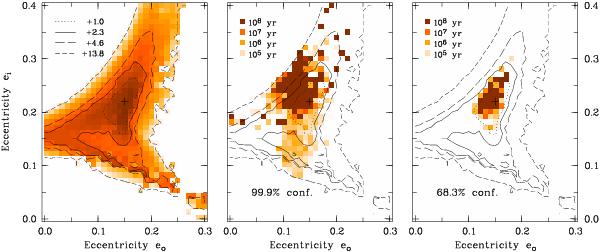
Results of fitting the Keplerian two-planet model to the eclipse-time data of NN Ser. Left: χ2 distribution in the eo, ei plane. The + sign indicates the minimum χ2 and the contour lines refer to the increments Δ χ2 indicated in the legend. Center: maximum lifetime τ of models with χ2 at the 99.9% confidence level (Δ χ2 = + 13.8 for two degrees of freedom). For ease of comparison, the χ2 contours of the left panel are included. Right: same for models with χ2 at the 68.3% confidence level (Δ χ2 = + 2.3).
Current usage metrics show cumulative count of Article Views (full-text article views including HTML views, PDF and ePub downloads, according to the available data) and Abstracts Views on Vision4Press platform.
Data correspond to usage on the plateform after 2015. The current usage metrics is available 48-96 hours after online publication and is updated daily on week days.
Initial download of the metrics may take a while.