Fig. 9
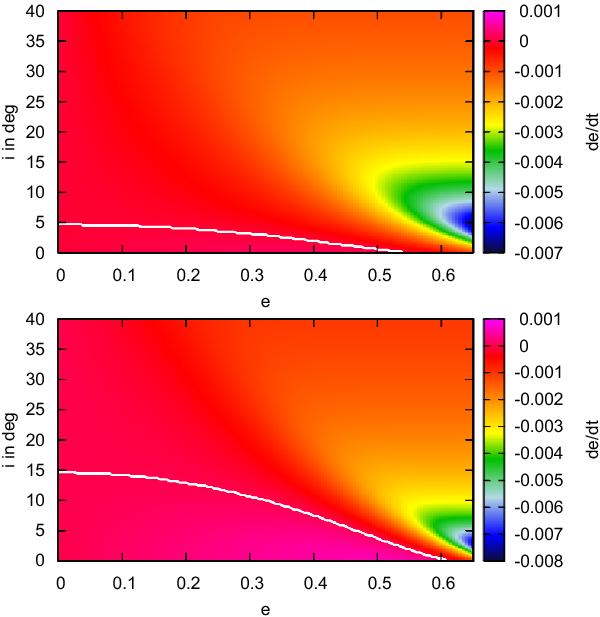
Top: de/dt for a 5 MJup planet with different eccentricities and inclinations. The values of de/dt have been determined with the formula given in Sect. 3.5. Bottom: same, but for 10 MJup. The white line in the figure indicates the transition between eccentricity increase and eccentricity damping. Below the white line, the eccentricity increases, above the line eccentricity decreases. We note the different colour coding as the change is dependent on the planetary mass.
Current usage metrics show cumulative count of Article Views (full-text article views including HTML views, PDF and ePub downloads, according to the available data) and Abstracts Views on Vision4Press platform.
Data correspond to usage on the plateform after 2015. The current usage metrics is available 48-96 hours after online publication and is updated daily on week days.
Initial download of the metrics may take a while.