Fig. 7
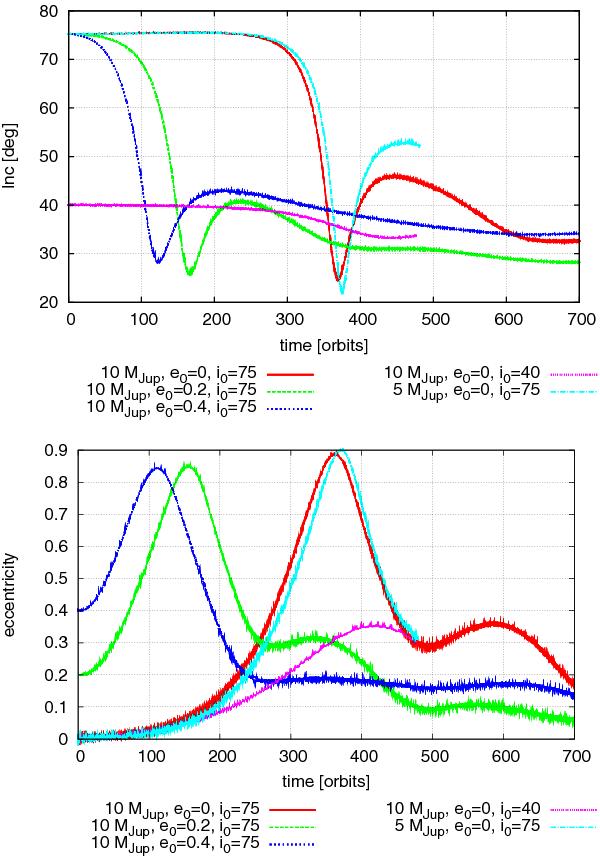
Long-term evolution of planets with different inclinations, eccentricities, and masses in discs. The simulations are started from the equilibrium structures with fixed planets, where the planets are then released and allowed to move freely inside the disc. The top plot features the inclination of the planets, while the bottom plot shows the eccentricity of the planets. In the beginning the changes of eccentricity and inclination match the ones displayed in Figs. 4 and 5.
Current usage metrics show cumulative count of Article Views (full-text article views including HTML views, PDF and ePub downloads, according to the available data) and Abstracts Views on Vision4Press platform.
Data correspond to usage on the plateform after 2015. The current usage metrics is available 48-96 hours after online publication and is updated daily on week days.
Initial download of the metrics may take a while.