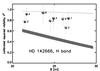
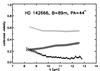
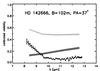
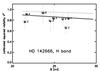
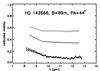
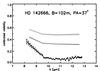
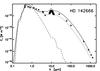
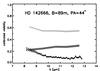
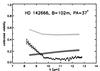
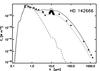
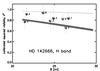
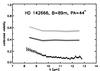
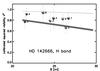
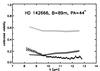
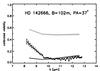
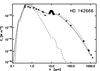
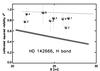
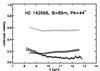
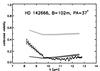
Fig. 1

Crosses in the SEDs (first column) represent measured photometric data obtained from the literature (Appendix A). The solid and the dashed curves represent the SED obtained from computer models, as well as its initial stellar flux, respectively. The dark and light gray bars in the figures of the second column result from H band images at λ = 1.65 μm of the models of HD 142666, while the crosses with the vertical error bars represent the measurements with IOTA. The bar width represents the interval that constrains the NIR visibilities V(λ) for different PAs but the same inclination of the model. Numbers added to the crosses are the position angles of the corresponding interferometric baseline. The measured MIR, spectrally dispersed visibilities (3rd and 4th columns) are represented by solid lines with error bars. The modeled visibilities (gray bars) were derived from model images at wavelengths of 8.5 μm, 9.5 μm, 10.6 μm, 11.5 μm, and 12.5 μm. The bar width represents the interval that constrains the MIR visibilities V(λ) for different PAs but the same inclination of the model. The upper row shows the effect after increasing the inner disk radius by a factor of five, from Rin = 0.1 AU (light gray; initial model i) to Rin = 0.5 AU (dark gray, model ii). The second row shows the result after increasing the profile parameters from β = 1.0 to β = 1.1 (model iii). The mass accretion rate is increased to Ṁ = 7 × 10⁻⁸ M⊙a-1 in model (iv) displayed in the third row while the mass density at the inner edge is decreased by a factor of fρ = 0.01 in the model (v) shown in the fourth row. In the sixth row, a dust-free disk gap is also cut in model (vi) after the density has decreased (model v). Model of row (vii) is identical to model (vi) but without decreasing the density as in model (v). The light gray bars also presented in all rows show the initial model (i) for comparison.


Current usage metrics show cumulative count of Article Views (full-text article views including HTML views, PDF and ePub downloads, according to the available data) and Abstracts Views on Vision4Press platform.
Data correspond to usage on the plateform after 2015. The current usage metrics is available 48-96 hours after online publication and is updated daily on week days.
Initial download of the metrics may take a while.