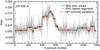
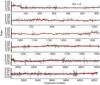
Fig. 6

Intensity variations of GX 339-4 and GX 1+4 in the 27–36 keV band as a function of the exposure number. The SPI segments are plotted in red and the IBIS raw light curves (26–40 keV) are drawn in gray. The segmented IBIS time series (scaled S/N) is shown in green. The count rate normalization between IBIS and SPI is arbitrary.
Current usage metrics show cumulative count of Article Views (full-text article views including HTML views, PDF and ePub downloads, according to the available data) and Abstracts Views on Vision4Press platform.
Data correspond to usage on the plateform after 2015. The current usage metrics is available 48-96 hours after online publication and is updated daily on week days.
Initial download of the metrics may take a while.