Free Access
Fig. 5
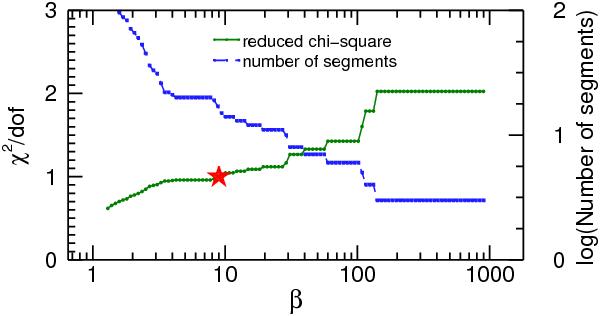
GX 339-4 time series segmentation. Variation of the  (green circles) and number of segments (blue squares) as a function of the penalty parameter value for the time series of Fig. 4. The red star indicates the value of the penalty parameter (β = 8.99) where = 1.0006 and which corresponds to 17 segments.
Current usage metrics show cumulative count of Article Views (full-text article views including HTML views, PDF and ePub downloads, according to the available data) and Abstracts Views on Vision4Press platform.
Data correspond to usage on the plateform after 2015. The current usage metrics is available 48-96 hours after online publication and is updated daily on week days.
Initial download of the metrics may take a while.