Fig. 4
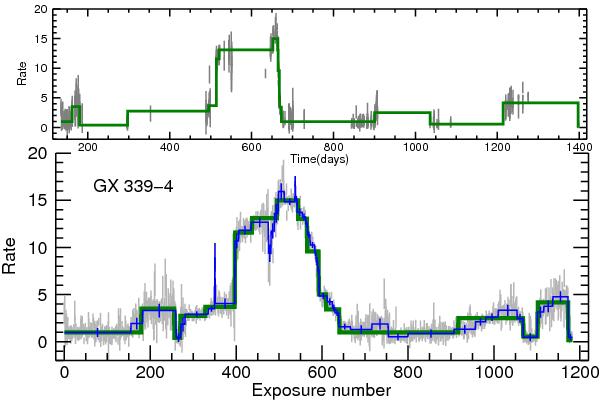
GX 339-4 intensity variations. The 26–40 keV IBIS time series (gray), which contains 1183 data points (one measurement per exposure), is segmented into 17 constant segments or “time bins” (green). The  between the time series and its segmented version is 1.0006 for 1166 d.o.f.. These curves are plotted as a function of time (top) and the exposure number (bottom). The raw time series (without S/N scaling) is directly segmented into 46 segments (bottom blue curve).
Current usage metrics show cumulative count of Article Views (full-text article views including HTML views, PDF and ePub downloads, according to the available data) and Abstracts Views on Vision4Press platform.
Data correspond to usage on the plateform after 2015. The current usage metrics is available 48-96 hours after online publication and is updated daily on week days.
Initial download of the metrics may take a while.