Fig. 15
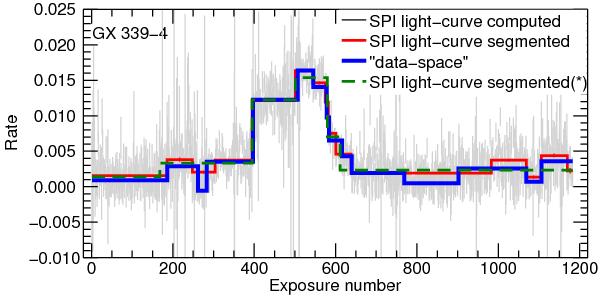
“Data-space” algorithm has modeled the temporal evolution of GX 339-4 in the 27–36 keV band with 15 constant segments (blue). The light curve (in gray) of GX 339-4 was obtained by directly processing SPI data (after fixing the temporal evolution of the other sources). It contains 1183 data points (one measurement per exposure) The red curve is the segmentation of the gray curve into 15 segments with the “image space” algorithm. (*) If the background is forced to vary exposure-by-exposure, the GX 339-4 light curve is segmented only into six segments (dashed-green).
Current usage metrics show cumulative count of Article Views (full-text article views including HTML views, PDF and ePub downloads, according to the available data) and Abstracts Views on Vision4Press platform.
Data correspond to usage on the plateform after 2015. The current usage metrics is available 48-96 hours after online publication and is updated daily on week days.
Initial download of the metrics may take a while.