Fig. 14
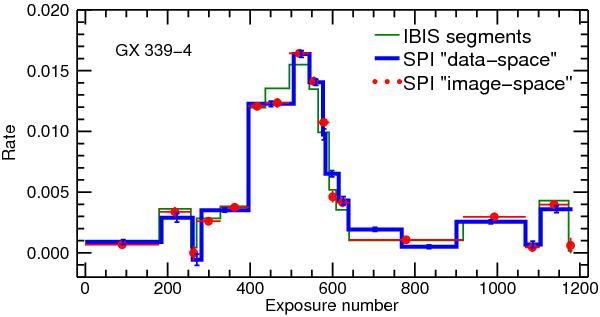
Comparison of GX 339-4 (27–36 keV) intensity variations obtained with the “image-space” and the “data-space” algorithms. The common SPI/IBIS database contains 1183 exposures. The “image space” method describes GX 339-4 intensity variations with 17 segments (red) for a  of 1.19. The “data-space” method uses 15 segments (blue) and achieves of 1.20. The GX 339-4 segmented version of the IBIS (26–40 keV) time series is shown in green. The absolute rate normalization between SPI and IBIS is arbitrary.
Current usage metrics show cumulative count of Article Views (full-text article views including HTML views, PDF and ePub downloads, according to the available data) and Abstracts Views on Vision4Press platform.
Data correspond to usage on the plateform after 2015. The current usage metrics is available 48-96 hours after online publication and is updated daily on week days.
Initial download of the metrics may take a while.