Fig. 7
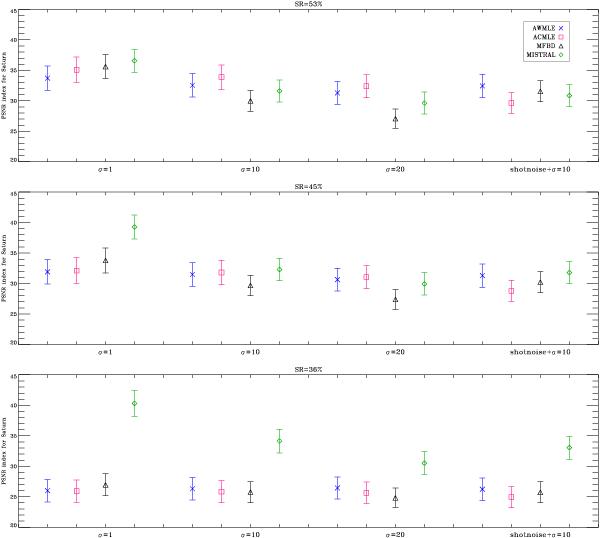
Each plot shows the mean value and standard deviation of the PSNR metric calculated from Saturn results obtained with ACMLE (pink squares), AWMLE (blue crosses), MISTRAL (green diamonds), and MFBD (black triangles). Deconvolution was performed with three PSFs to represent different levels of miscalibration. Top row: dataset was deconvolved with a matched PSF (SR = 53%). Middle row: dataset was deconvolved with a mismatched PSF (SR = 45%). Bottom row: dataset was deconvolved with a highly mismatched PSF (SR = 36%).
Current usage metrics show cumulative count of Article Views (full-text article views including HTML views, PDF and ePub downloads, according to the available data) and Abstracts Views on Vision4Press platform.
Data correspond to usage on the plateform after 2015. The current usage metrics is available 48-96 hours after online publication and is updated daily on week days.
Initial download of the metrics may take a while.