Fig. 4
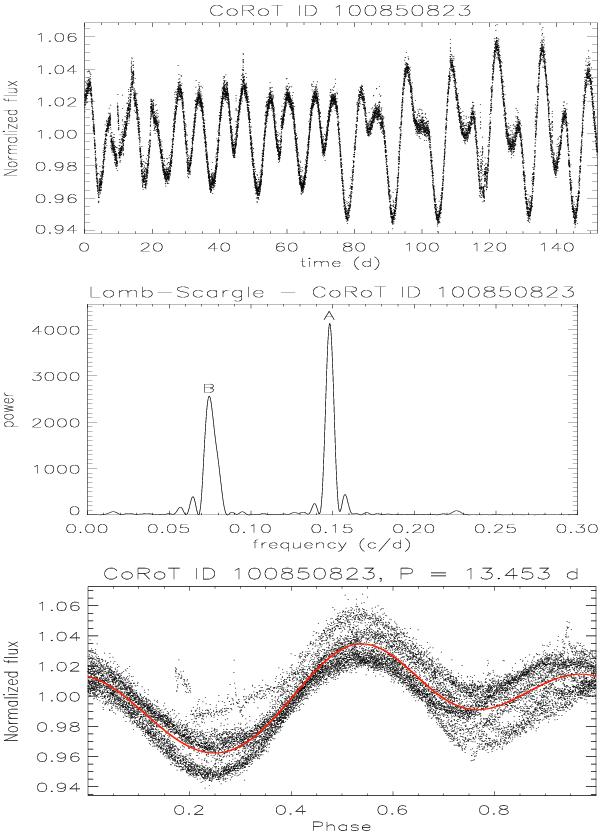
Example of a LC interpreted as having two subcycles per cycle. Top panel: original LC. Medium panel: Lomb-Scargle periodogram showing the main peak (A) with a period of 6.75 days, and a second peak (B) with a period of 13.4 days. Bottom panel: phase diagram for a period of 13.453 days (adjusted to the highest amplitude and lowest dispersion), showing one full cycle with two subcycles and a harmonic fit depicted by the solid line.
Current usage metrics show cumulative count of Article Views (full-text article views including HTML views, PDF and ePub downloads, according to the available data) and Abstracts Views on Vision4Press platform.
Data correspond to usage on the plateform after 2015. The current usage metrics is available 48-96 hours after online publication and is updated daily on week days.
Initial download of the metrics may take a while.