Fig. 12
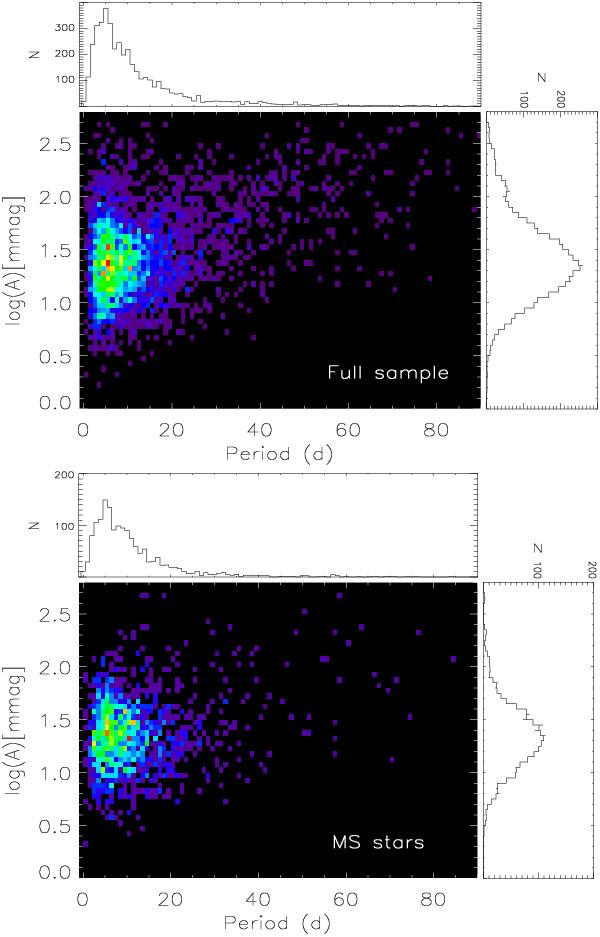
Logarithm of variability amplitude (in mmag) as a function of period. Top panel: the final sample described in Sect. 2. Bottom panel: only stars from luminosity class V. In the colored grids, red represents a greater number of stars, purple indicates a lower number of stars, and black depicts an absence of stars. The distribution of amplitude is shown at the right side of each panel and the period distribution is indicated at the top of each panel.
Current usage metrics show cumulative count of Article Views (full-text article views including HTML views, PDF and ePub downloads, according to the available data) and Abstracts Views on Vision4Press platform.
Data correspond to usage on the plateform after 2015. The current usage metrics is available 48-96 hours after online publication and is updated daily on week days.
Initial download of the metrics may take a while.