Fig. 9
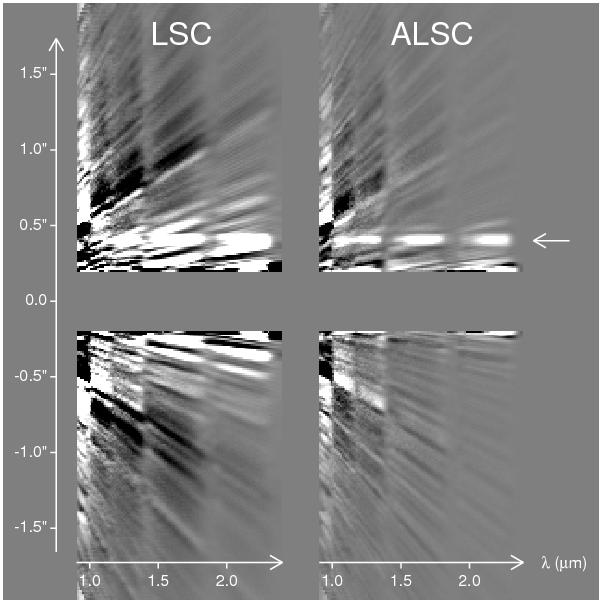
Same simulated data as Fig. 8 after applying the spectral deconvolution data analysis method. The fake companion at a separation of 0.4′′ is now clearly visible as a horizontal signal 0.2′′ above the coronagraphic mask position (left-pointing arrow). Although the diffraction residuals of the LSC have been attenuated, they are still visible and obviously bias the signal of the companion.
Current usage metrics show cumulative count of Article Views (full-text article views including HTML views, PDF and ePub downloads, according to the available data) and Abstracts Views on Vision4Press platform.
Data correspond to usage on the plateform after 2015. The current usage metrics is available 48-96 hours after online publication and is updated daily on week days.
Initial download of the metrics may take a while.