Fig. 8
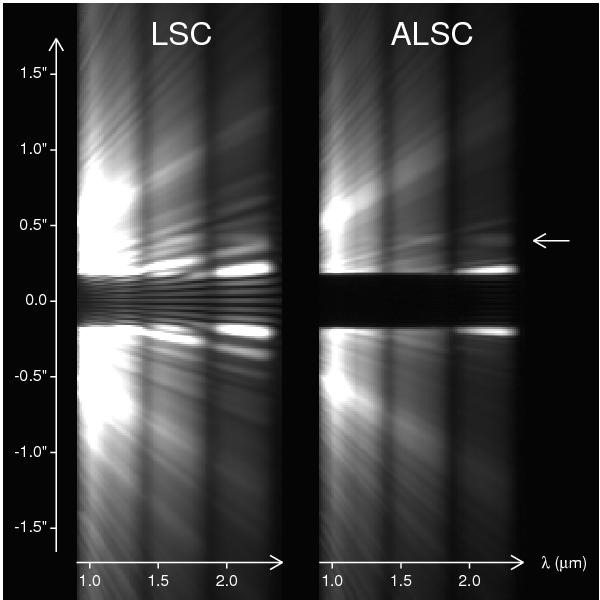
Simulated data with the LSC (left) and ALSC (right) designs representing a 1-h total integration time on a G0 star at 10 pc. A fake companion (Teff = 1400 K, log g = 5.0) has been introduced at a separation of +0.4′′ from the star (left pointing arrow). The dark horizontal band at the center of the spectra corresponds to the position of the opaque coronagraphic mask, while the two dark vertical bands around 1.4 and 1.9 μm are due to the atmospheric absorption. The display scale is identical for both spectra. Strong diffraction residuals are clearly visible on either side of the coronagraphic mask for the LSC, while the apodizer has almost completely suppressed diffraction for the ALSC.
Current usage metrics show cumulative count of Article Views (full-text article views including HTML views, PDF and ePub downloads, according to the available data) and Abstracts Views on Vision4Press platform.
Data correspond to usage on the plateform after 2015. The current usage metrics is available 48-96 hours after online publication and is updated daily on week days.
Initial download of the metrics may take a while.