Fig. 17
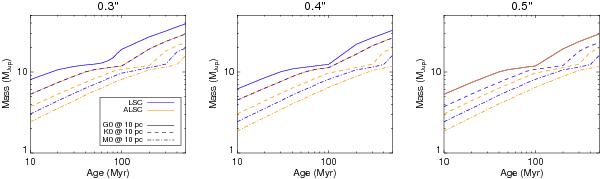
Mass of the planets that could be characterized with the LSC (blue) and ALSC (orange) at 0.3′′, 0.4′′, and 0.5′′ from G0 (plain), K0 (dashed), and M0 (dash-dotted) stars at 10 pc, assuming ϵ ≤ 48% (eTeff within ±20% for 68% of the models). The mass is obtained using AMES-COND evolutionary models (Baraffe et al. 2003). The curves for the LSC and the ALSC above 0.5′′ are almost identical.
Current usage metrics show cumulative count of Article Views (full-text article views including HTML views, PDF and ePub downloads, according to the available data) and Abstracts Views on Vision4Press platform.
Data correspond to usage on the plateform after 2015. The current usage metrics is available 48-96 hours after online publication and is updated daily on week days.
Initial download of the metrics may take a while.