Fig. 15
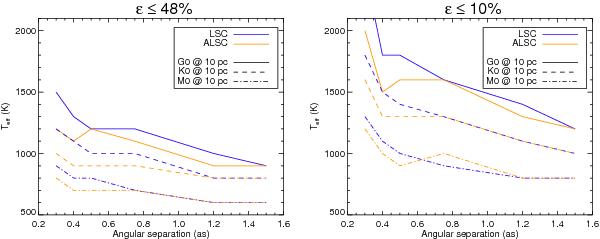
Lower limits in Teff with the LSC (blue) and ALSC (orange) for all models with ϵ ≤ 48% and ϵ ≤ 10% around G0 (plain), K0 (dashed), and M0 (dash-dotted) stars at 10 pc as a function of angular separation. The cutoffs on ϵ correspond to the limit where more than 68% and 95% of the simulated models have eTeff within ±20%. For ϵ ≤ 10%, the LSC curve at 0.3′′ reaches 2500 K.
Current usage metrics show cumulative count of Article Views (full-text article views including HTML views, PDF and ePub downloads, according to the available data) and Abstracts Views on Vision4Press platform.
Data correspond to usage on the plateform after 2015. The current usage metrics is available 48-96 hours after online publication and is updated daily on week days.
Initial download of the metrics may take a while.