Fig. 13
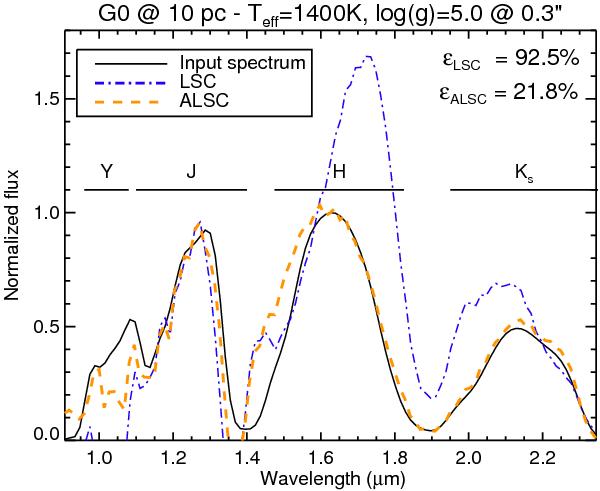
Spectral extraction of a companion with Teff = 1400 K and log g = 5.0 simulated at 0.3′′ from a G0 star at 10 pc (contrast of 10.6 mag) using the LSC and ALSC coronagraphs. The plot shows input planet spectrum (black, plain), and the extracted planet spectrum from data simulated with the LSC (blue, dash-dotted) and the ALSC (orange, dashed). The restoration factor ϵ has a lower value with the ALSC, denoting a better restoration of the planet spectrum.
Current usage metrics show cumulative count of Article Views (full-text article views including HTML views, PDF and ePub downloads, according to the available data) and Abstracts Views on Vision4Press platform.
Data correspond to usage on the plateform after 2015. The current usage metrics is available 48-96 hours after online publication and is updated daily on week days.
Initial download of the metrics may take a while.