Free Access
Fig. 11
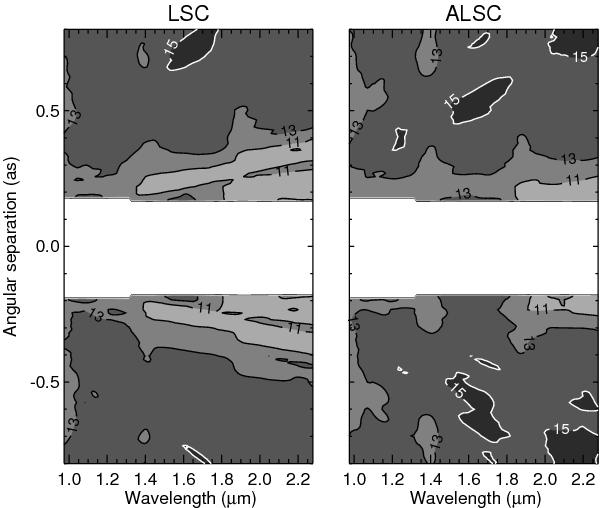
5σ noise level after SD at all wavelengths, given in magnitude difference with respect to the star, and averaged for all our simulated data sets. Only the central area between − 0.8′′ and 0.8′′ is plotted since the gain of the ALSC is mainly visible at small angular separation.
Current usage metrics show cumulative count of Article Views (full-text article views including HTML views, PDF and ePub downloads, according to the available data) and Abstracts Views on Vision4Press platform.
Data correspond to usage on the plateform after 2015. The current usage metrics is available 48-96 hours after online publication and is updated daily on week days.
Initial download of the metrics may take a while.