Fig. 10
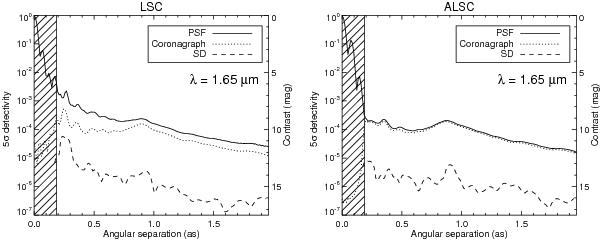
5σ detectivity for the LSC (left) and ALSC (right) after attenuation of the speckles with the SD method. The data was simulated assuming bright AO guide star and without detection noise to be in a regime truly limited by speckle noise. The plots show the contrast curves at λ = 1.65 μm with the PSF profile (plain), the coronagraphic profile (dotted), and the 5σ noise level after SD (dashed). The hatched area corresponds to the location of the opaque coronagraphic mask.
Current usage metrics show cumulative count of Article Views (full-text article views including HTML views, PDF and ePub downloads, according to the available data) and Abstracts Views on Vision4Press platform.
Data correspond to usage on the plateform after 2015. The current usage metrics is available 48-96 hours after online publication and is updated daily on week days.
Initial download of the metrics may take a while.