Fig. 3
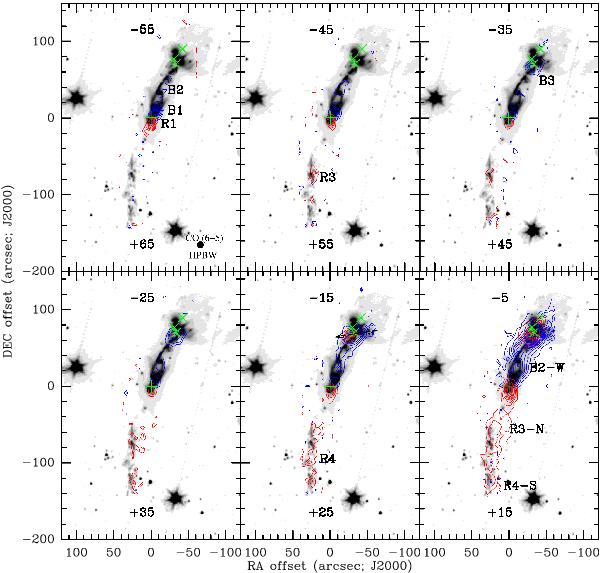
CO (6−5) maps of the L1448-mm/IRS3 region in different velocity ranges, overlaid on the Spitzer/IRAC 4.5 μm image. Each panel shows the integrated red- and blueshifted emission in a 10 km s-1 wide velocity interval, centered on the velocity shown in the bottom (redshifted) and top (blueshifted) part of each panel. The contour spacing is 2σ, with the first contour at 3σ (σ = 1.20 K km s-1 for blue contours and σ = 1.61 K km s-1 for red contours). The (0, 0) offset refers to the position of L1448-mm central source (see Table 1), also indicated by a green plus symbol. The green crosses represent the position of the members of the IRS3 system (3A, 3B, and 3C: Kwon et al. 2006) The arrow in the bottom-middle panel indicates the direction of the outflow system from IRS3. The peak values for the highest velocity range are 11.3 K km s-1 for B1 and 10.3 K km s-1 for R1.
Current usage metrics show cumulative count of Article Views (full-text article views including HTML views, PDF and ePub downloads, according to the available data) and Abstracts Views on Vision4Press platform.
Data correspond to usage on the plateform after 2015. The current usage metrics is available 48-96 hours after online publication and is updated daily on week days.
Initial download of the metrics may take a while.