Fig. 2
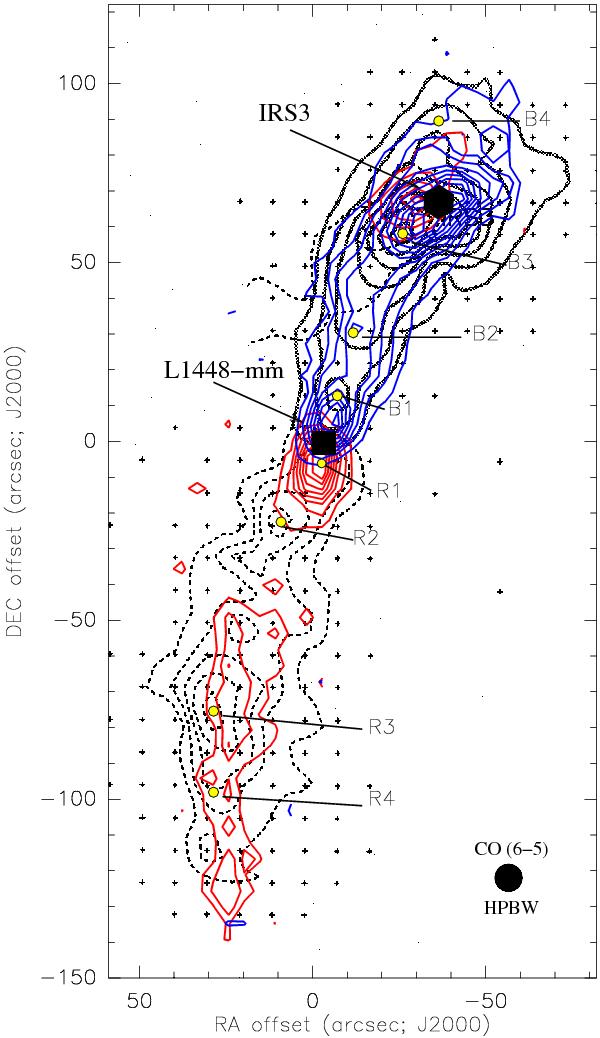
CO (6−5) high-velocity emission in the L1448-mm/IRS3 system. Blue contours show the blueshifted wing (from −55 km s-1 to 0 km s-1) and red contours the redshifted wing (from +10 km s-1 to +65 km s-1). The contour spacing is 2σ, with the first contour at 3σ (σ = 3.95 K km s-1 for blue and σ = 5.65 K km s-1 for red). The central (0, 0) position is located at the coordinates of L1448-mm source (see Table 2) and indicated by the black square. The black hexagon represents the position of IRS3 (offset −38, + 70). Black contours (solid and dashed) show the CO (2−1) emission from Bachiller et al. (1990), integrated in the same velocity ranges. The black crosses indicate the coverage of the CO (2−1) map, which is roughly identical in CO (6−5). Yellow circles indicate the positions of all clumps reported by Bachiller et al. (1990). Also shown with a black filled circle is the HPBW at the frequency of the CO (6−5) transition.
Current usage metrics show cumulative count of Article Views (full-text article views including HTML views, PDF and ePub downloads, according to the available data) and Abstracts Views on Vision4Press platform.
Data correspond to usage on the plateform after 2015. The current usage metrics is available 48-96 hours after online publication and is updated daily on week days.
Initial download of the metrics may take a while.