Free Access
Fig. 19
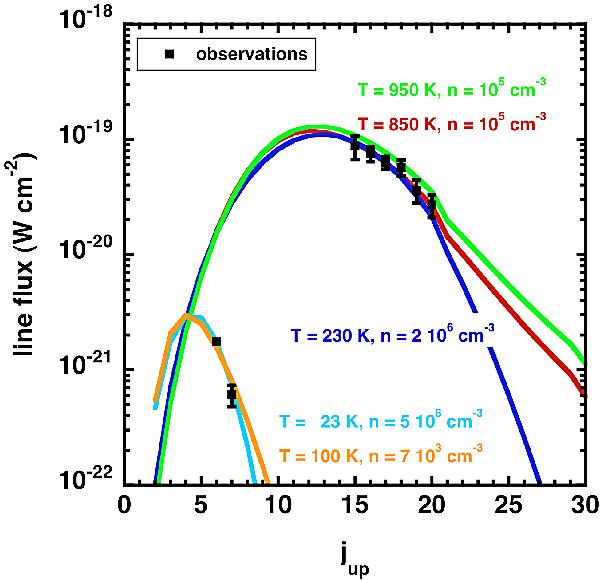
LVG model fits to CO-SLED for the total integrated emission in HH211. Red, green, and blue show the LVG fits to the high-J CO emission. Orange and light-blue lines are the LVG fits to the mid-J CO emission.
Current usage metrics show cumulative count of Article Views (full-text article views including HTML views, PDF and ePub downloads, according to the available data) and Abstracts Views on Vision4Press platform.
Data correspond to usage on the plateform after 2015. The current usage metrics is available 48-96 hours after online publication and is updated daily on week days.
Initial download of the metrics may take a while.