Fig. 18
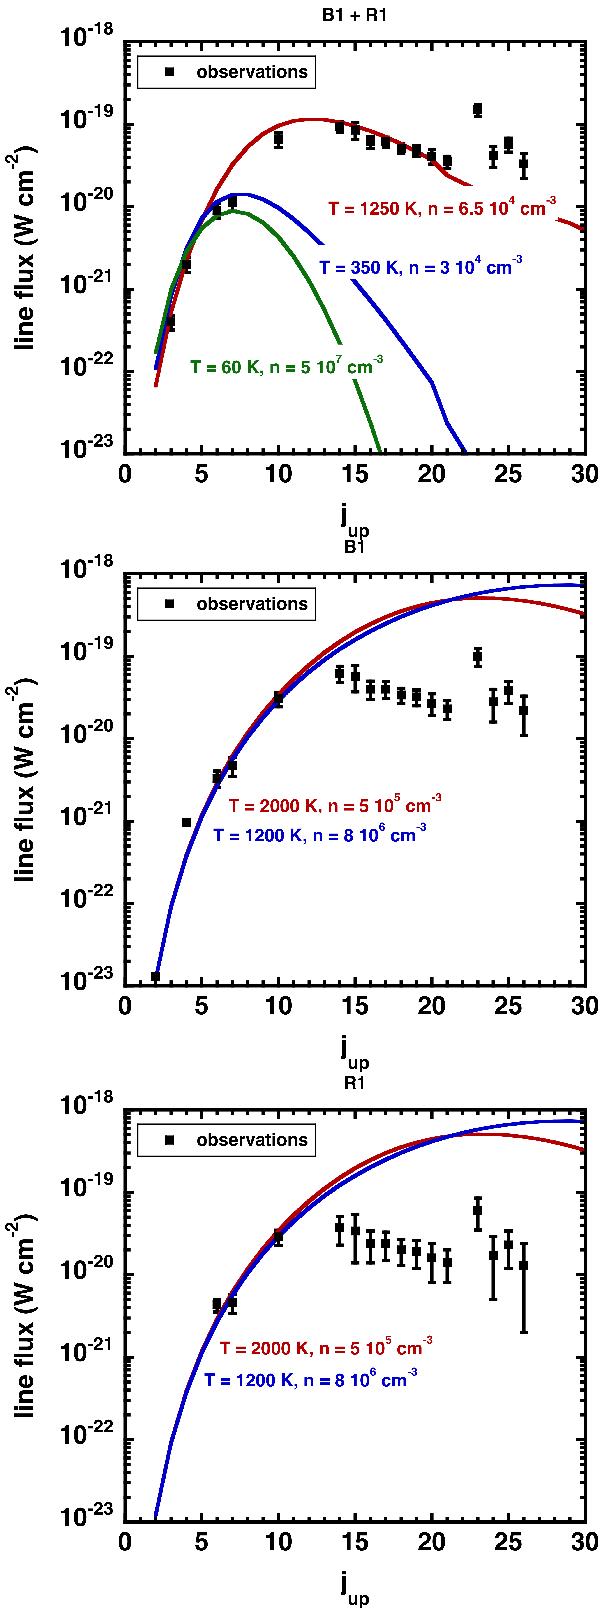
LVG model fits to CO-SLED in the EHV range in L1448: combined B1 and R1 EHV emission (upper panel), B1 only (middle panel), and R1 only (lower panel). In the upper panel the red line shows the best fit to the ISO high-JCO data, while blue and green show the fits to the low- and mid-J CO data. In the middle and lower panels the red and blue lines show the best fits to the low- and mid-J CO data points.
Current usage metrics show cumulative count of Article Views (full-text article views including HTML views, PDF and ePub downloads, according to the available data) and Abstracts Views on Vision4Press platform.
Data correspond to usage on the plateform after 2015. The current usage metrics is available 48-96 hours after online publication and is updated daily on week days.
Initial download of the metrics may take a while.