Free Access
Fig. 17
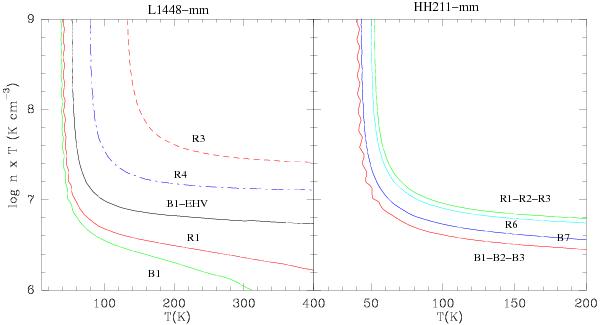
Thermal pressure vs temperature plot from LVG calculations. The panels show the 6−5/7−6 observed ratios at different positions in L1448-mm (left) and in HH211-mm (right). With the exception of B1-EHV in L1448-mm, line ratios are computed from the total integrated emission.
Current usage metrics show cumulative count of Article Views (full-text article views including HTML views, PDF and ePub downloads, according to the available data) and Abstracts Views on Vision4Press platform.
Data correspond to usage on the plateform after 2015. The current usage metrics is available 48-96 hours after online publication and is updated daily on week days.
Initial download of the metrics may take a while.