Fig. 11
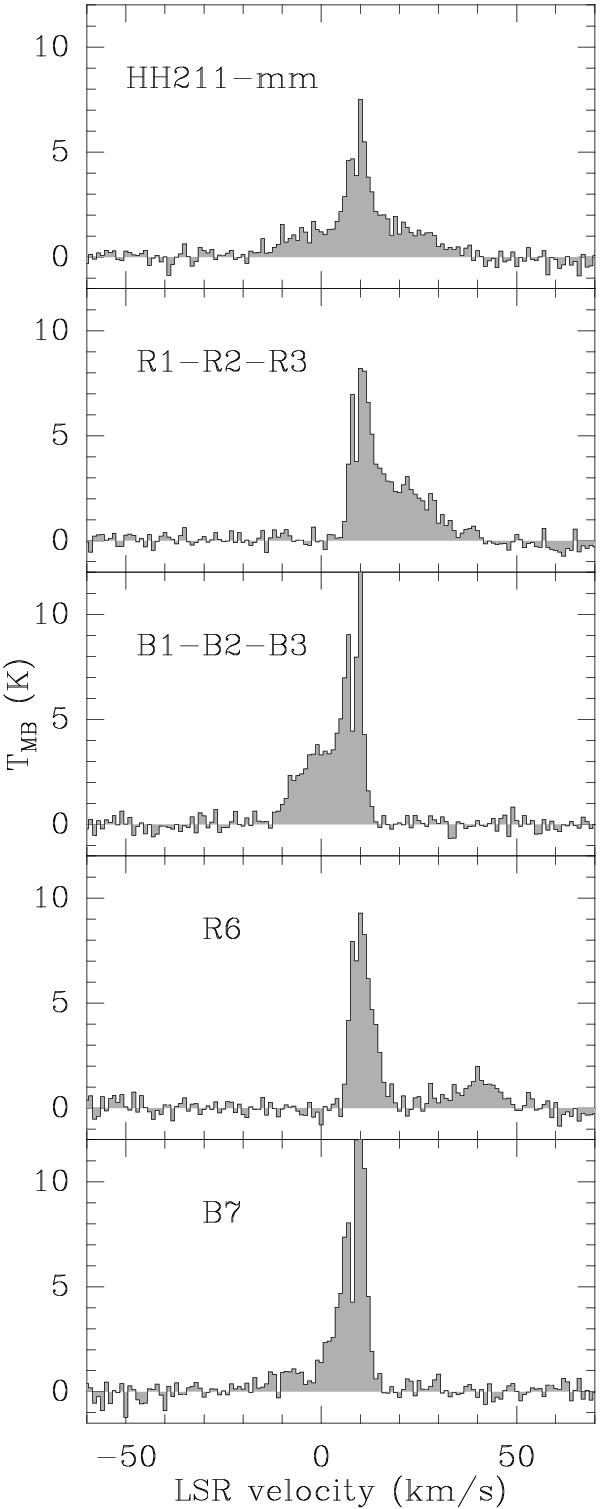
CO (6−5) sample of spectra at selected positions in HH211. The spectral resolution is 1 km s-1. Upper left corner of each panel indicates the position at which the spectrum was taken. The positions are also indicated in Fig. 9. The clumps B7 and R6 show secondary peaks at high velocities. The absorption feature at the cloud velocity (VLSR = 9.2 km s-1) is observed in all the positions shown here, which likely comes from the contamination of the reference position.
Current usage metrics show cumulative count of Article Views (full-text article views including HTML views, PDF and ePub downloads, according to the available data) and Abstracts Views on Vision4Press platform.
Data correspond to usage on the plateform after 2015. The current usage metrics is available 48-96 hours after online publication and is updated daily on week days.
Initial download of the metrics may take a while.