Fig. 1
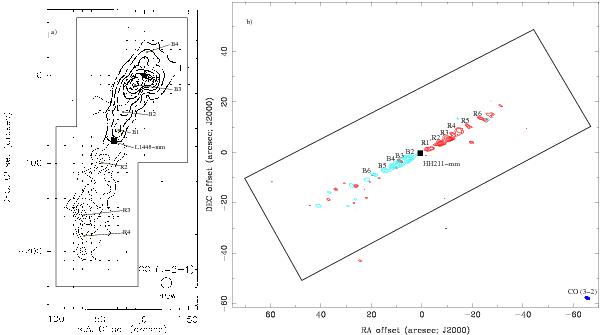
a) CO (2−1) high-velocity emission in the L1448/IRS3 system, taken from Bachiller et al. (1990). The contours show the integrated emission in the ranges from −55 km s-1 to 0 km s-1 (solid) and from +10 km s-1 to +65 km s-1 (dashed). First contour and contour interval are 10 K km s-1. The central (0, 0) offset position is located at the position of IRS3 (black star), while the position of L1448-mm source is shown by the black square. The labels indicate the position of all clumps reported by Bachiller et al. (1990). b) The CO (3−2) high-velocity emission in HH211 taken from Palau et al. (2006). The contours show the integrated emission in the ranges from −14 km s-1 to 0 km s-1 (blue) and from +20 km s-1 to +40 km s-1 (red). The contour interval is 2σ, while first contour is 4σ (σ = 2.21 and 2.38 Jy beam-1 km s-1, for blue- and redshifted, respectively). The central (0, 0) offset position is located at the position of H211-mm (black square). The labels indicate the position of all clumps reported by Palau et al. (2006) and Hirano et al. (2006). In a) and b), the beam of each observation is shown at the bottom-right, while the black polygons delineate approximately the area covered by the CO (6−5) and (7−6) observations.
Current usage metrics show cumulative count of Article Views (full-text article views including HTML views, PDF and ePub downloads, according to the available data) and Abstracts Views on Vision4Press platform.
Data correspond to usage on the plateform after 2015. The current usage metrics is available 48-96 hours after online publication and is updated daily on week days.
Initial download of the metrics may take a while.