Fig. 5
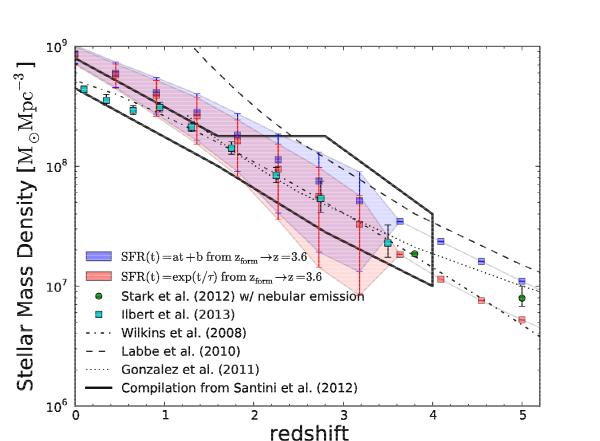
Evolution of the cosmic SMD vs. redshift. The lines with blue and red boxes are the mean values evaluated by integration while the lighter colors show the uncertainties from the 2000 runs as in previous figures. We overplot the trends found in Labbe et al. (2010) at z = 7–8, Gonzalez et al. (2011) and Stark et al. (2013) at 3 < z < 7. We also plot the line corresponding to the compilation of published measurements in Wilkins et al. (2008). Within the uncertainties, we find a good agreement of the SMD integrated from the SFRD with all other SMDs based on galaxy surveys from z = 0.6 to z = 5. The black-limited area represents the compilation of results in Santini et al. (2012). Scaled to the same cosmology and IMF (Salpeter). Using Gonzalez et al. (2011), we integrate down to luminosities equivalent to M ~ 2500 M⊙.
Current usage metrics show cumulative count of Article Views (full-text article views including HTML views, PDF and ePub downloads, according to the available data) and Abstracts Views on Vision4Press platform.
Data correspond to usage on the plateform after 2015. The current usage metrics is available 48-96 hours after online publication and is updated daily on week days.
Initial download of the metrics may take a while.