Fig. 4
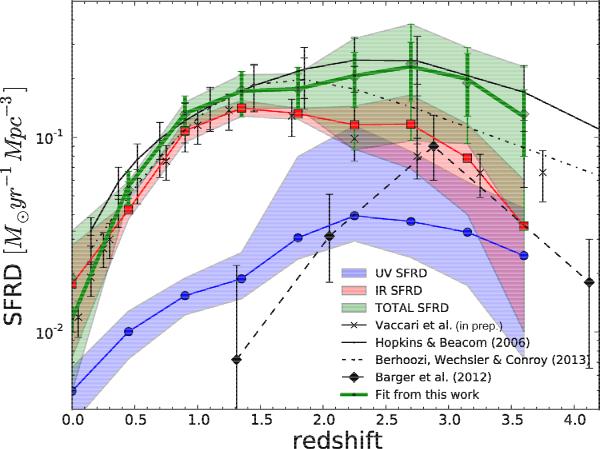
SFRD densities in the FUV (blue), in the FIR (red), and in total (i.e., FUV + FIR) in green (other colors are due to overlaps of the previous colors). The lines are the mean values, while the lighter colors show the uncertainties evaluated from the 2000 runs as in Fig. 2. After the initial increase of the total SFRD from z = 0 to z ~ 1.2, it remains flat or slightly increases/decreases up to z ~ 2.5−3.0 followed by a decrease. Globally and over 0 < z ≤ 3.6, the total average SFRD is slightly below that reported in Hopkins & Beacom (2006) and agrees with that of Behroozi et al. (2012) up to z ~ 2. The SFRD from Barger et al. (2012) and preliminary results from Herschel/SPIRE estimated by Vaccari et al. (in prep.) agree with these trends. Symbols and lines are explained in the plot.
Current usage metrics show cumulative count of Article Views (full-text article views including HTML views, PDF and ePub downloads, according to the available data) and Abstracts Views on Vision4Press platform.
Data correspond to usage on the plateform after 2015. The current usage metrics is available 48-96 hours after online publication and is updated daily on week days.
Initial download of the metrics may take a while.