Fig. 3
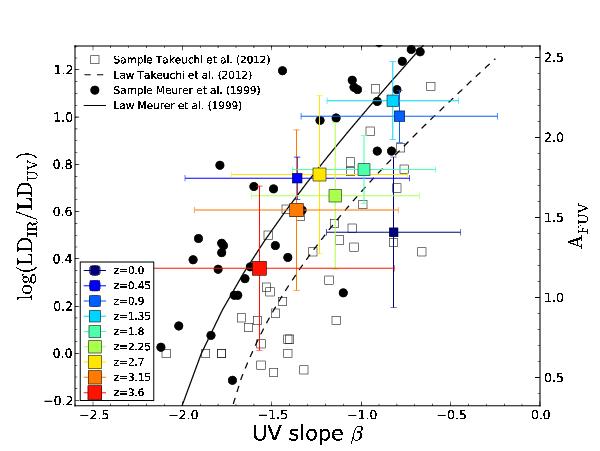
Dust attenuation vs. redshift. The boxes are color-coded according to redshift. Note that the x-axis bars correspond to the dispersion in UV slope while the y-axis bars are evaluated from the uncertainties in the LFs. The black dots denote the original data points from Meurer et al. (1999) and the black curve plots the law of Meurer et al. (1999). The black dashed line and gray boxes denote the update (using the same apertures in FUV and in FIR) from Takeuchi et al. (2012). Strictly speaking, our points and those from Meurer et al. (1999) are not comparable because we used volume-corrected LFs and not individual galaxies as in Meurer et al. (1999). In the diagram, the color-coded points show an almost continuous decrease with increasing redshift and lie in between the Meurer et al. (1999) and Takeuchi et al. (2012) laws. We emphasize that the dust attenuation AFUV is estimated from the IRX and not from the UV slope β.
Current usage metrics show cumulative count of Article Views (full-text article views including HTML views, PDF and ePub downloads, according to the available data) and Abstracts Views on Vision4Press platform.
Data correspond to usage on the plateform after 2015. The current usage metrics is available 48-96 hours after online publication and is updated daily on week days.
Initial download of the metrics may take a while.