Fig. 2
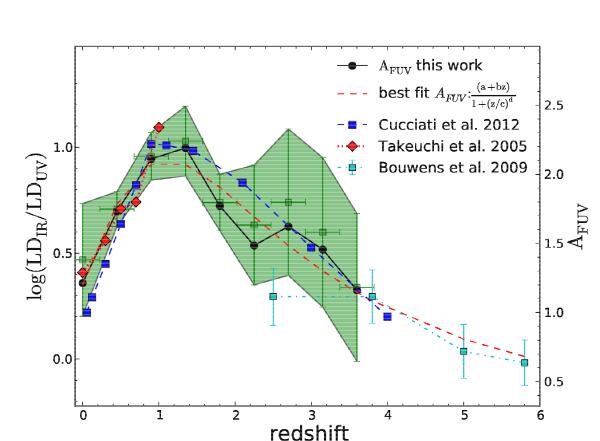
Left axis: ratio of the FIR-to-FUV LDs (IRX). Right axis: FUV dust attenuation (AFUV). The red dotted line with red diamonds is taken from Takeuchi et al. (2005). The green filled area and green dots are the associated uncertainties estimated through bootstrapping with 2000 drawings. Black dots denote the values directly computed from the LFs. At z = 3.6, AFUV reaches about the same value as at z = 0. Takeuchi et al. (2005) (red diamonds) used an approach identical to ours while an SED analysis (no FIR data) is performed in Cucciati et al. (2012) (blue boxes). Bouwens et al. (2009) are estimates based on the UV slope β. The limiting FUV luminosity is 107L⊙ or  . The best fit is given by
  with a = 1.20, b = 1.50, c = 1.77, and d = 2.19.
Current usage metrics show cumulative count of Article Views (full-text article views including HTML views, PDF and ePub downloads, according to the available data) and Abstracts Views on Vision4Press platform.
Data correspond to usage on the plateform after 2015. The current usage metrics is available 48-96 hours after online publication and is updated daily on week days.
Initial download of the metrics may take a while.