Fig. 10

TFR for the sample of high-quality cluster galaxies, separated into dusty red galaxies (red stars) and blue cloud galaxies (blue squares). The black line indicates the best-fit bisector regression line for the whole cluster sample. Fixing the slope to this value, the red dash-dotted and blue dashed lines depict the corresponding best-fit lines for dusty reds and blue clouds, respectively. B-band (left panel): for a given velocity, dusty red galaxies are on average 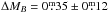 fainter than blue cloud galaxies. Stellar mass (right panel): the difference between the average residuals of dusty red and blue cloud galaxies is not significant (ΔM∗ = 0.06 ± 0.05).
Current usage metrics show cumulative count of Article Views (full-text article views including HTML views, PDF and ePub downloads, according to the available data) and Abstracts Views on Vision4Press platform.
Data correspond to usage on the plateform after 2015. The current usage metrics is available 48-96 hours after online publication and is updated daily on week days.
Initial download of the metrics may take a while.