Fig. 11
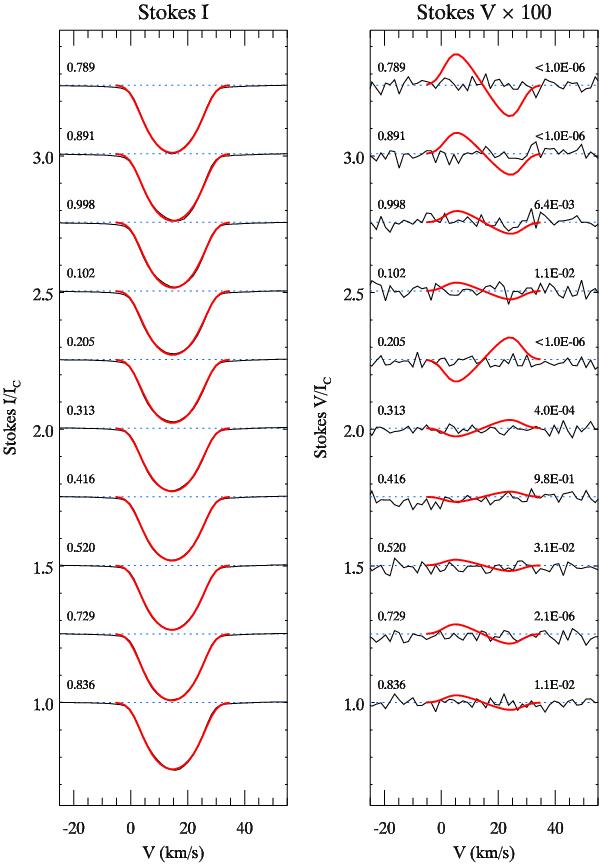
LSD Stokes I (left panel) and V (right panel) profiles of the HgMn star HD 11753. Thin lines show observations by Makaganiuk et al. (2012) obtained during 10 nights, starting on 2010-01-04 (top profile) and ending on 2010-01-14 (bottom profile). The thick curves correspond to the minimum-amplitude Stokes V model profiles reproducing the longitudinal field measurements obtained from the same observational data by Hubrig et al. (2012). Rotational phases are indicated on the left side of each panel. The numbers on the right side of the Stokes V panel report the probability that observations and model profiles are compatible within the error bars.
Current usage metrics show cumulative count of Article Views (full-text article views including HTML views, PDF and ePub downloads, according to the available data) and Abstracts Views on Vision4Press platform.
Data correspond to usage on the plateform after 2015. The current usage metrics is available 48-96 hours after online publication and is updated daily on week days.
Initial download of the metrics may take a while.