Fig. 10
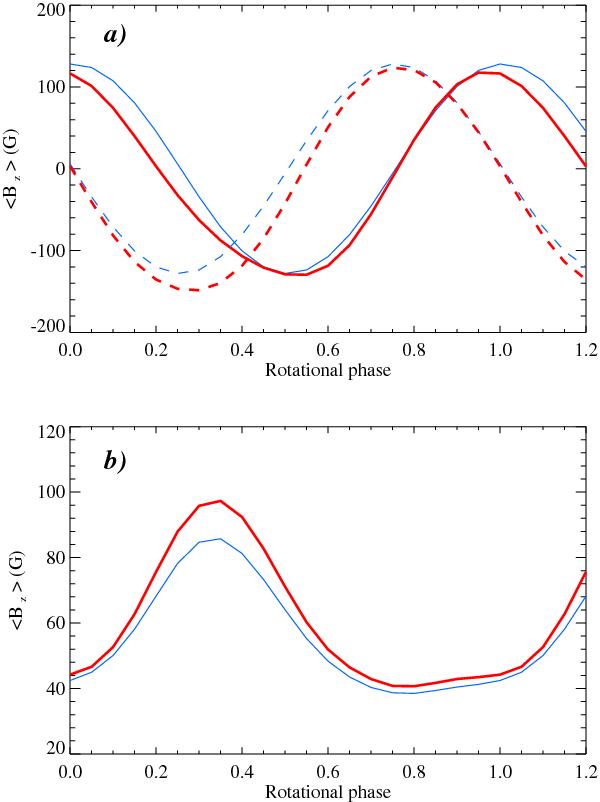
Effect of Y spots on the determination of the mean longitudinal magnetic field of the HgMn star HD 11753. The curves show ⟨ Bz ⟩ as a function of rotation phase for the Y map derived by Makaganiuk et al. (2012) (thick lines) and for a uniform element distribution (thin lines). a) Calculations for the dipolar field topology with a polar strength of 500 G, obliquity β = 90°, and two different orientations with respect to the reference rotation phase (solid and dashed lines). b) Calculations for the radial magnetic field map scaled according to the Y abundance distribution.
Current usage metrics show cumulative count of Article Views (full-text article views including HTML views, PDF and ePub downloads, according to the available data) and Abstracts Views on Vision4Press platform.
Data correspond to usage on the plateform after 2015. The current usage metrics is available 48-96 hours after online publication and is updated daily on week days.
Initial download of the metrics may take a while.