Fig. 5
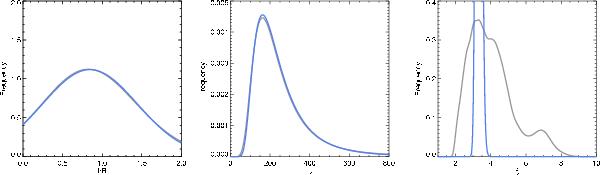
Inferred distributions for the transverse inhomogeneity length scale (left panel), the Alfvén travel time (central panel), and the density contrast between the tube and the environment (right panel). Grey curves represent the marginalized inferred distribution, obtained as the mean of the priors of Sect. 2.4 with parameters distributed according to Fig. 4. Blue lines are the distributions of Sect. 2.4 evaluated at the peak of the distributions of Fig. 4.
Current usage metrics show cumulative count of Article Views (full-text article views including HTML views, PDF and ePub downloads, according to the available data) and Abstracts Views on Vision4Press platform.
Data correspond to usage on the plateform after 2015. The current usage metrics is available 48-96 hours after online publication and is updated daily on week days.
Initial download of the metrics may take a while.