Fig. 3
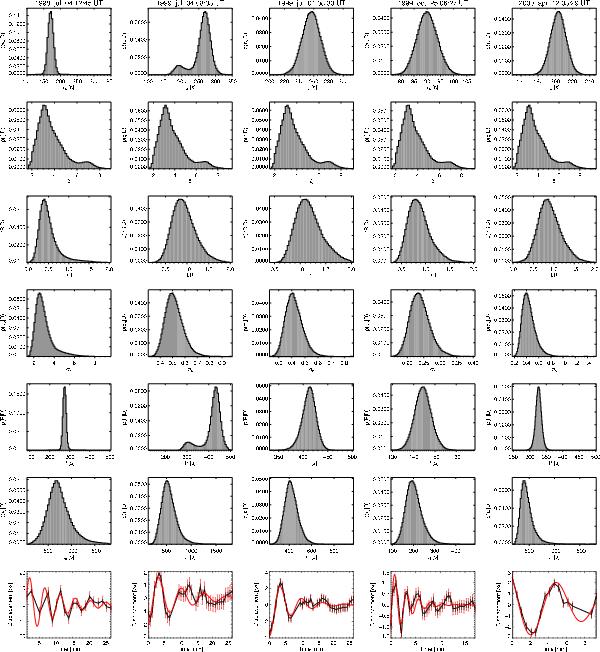
Posterior distributions for the model parameters of a sample of five coronal loops.
They display the state of knowledge for all physical parameters of all loops when
the observations are taken into account. Shown are the inferred Alfvén travel time
(first row), density contrast (second row),
length scale (third row), standard deviation of the background
(fourth row), derived oscillation period (fifth
row), and damping time (sixth row). The last row shows
the original oscillation corrected for the trend (black curve) and the best fit (red
curve). The black error bars are those associated with
σn, while the red error bars are obtained using
 .
.
Current usage metrics show cumulative count of Article Views (full-text article views including HTML views, PDF and ePub downloads, according to the available data) and Abstracts Views on Vision4Press platform.
Data correspond to usage on the plateform after 2015. The current usage metrics is available 48-96 hours after online publication and is updated daily on week days.
Initial download of the metrics may take a while.