Fig. 1
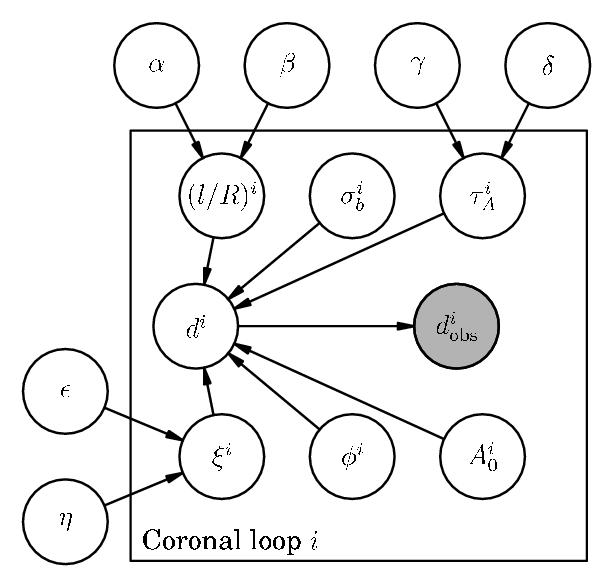
Graphical model representing the hierarchical Bayesian scheme that we used to analyze the set of coronal loop oscillations. Open circles represent random variables (we note that both model parameters and observations are considered as random variables), while the grey circle represents a measured quantity. The frame labeled “Coronal loop i” indicates that the model has to be repeated for all the observations. An arrow between two nodes illustrates dependency. The nodes that are outside the frame are the hyperparameters of the model and are common to all coronal loops.
Current usage metrics show cumulative count of Article Views (full-text article views including HTML views, PDF and ePub downloads, according to the available data) and Abstracts Views on Vision4Press platform.
Data correspond to usage on the plateform after 2015. The current usage metrics is available 48-96 hours after online publication and is updated daily on week days.
Initial download of the metrics may take a while.